Definition
SUMMARY
Produces Boolean graphical representations of potential test case results, to aid in selecting efficient and complete test cases
One weakness of boundary value analysis and EPM (Equivalence Partitioning Method) is that they do not explore combinations of inputs.
- For instance, out of memory issues cannot simply be detected with a boundary value analysis
A cause-effect graph is a method used in black-box testing to translate natural-language specifications into a formal language:
- the specification is divided into workable pieces
- the causes and effects in the specification are identified (input > output). Each cause-effect chain is assigned a unique number
- a boolean graph linking the causes and effects is created
- impossible chains are annotated (due to syntactic or environmental contraints)
- the graph is converted into a limited-entry decision table
- each column in the decision table is converted into a test case
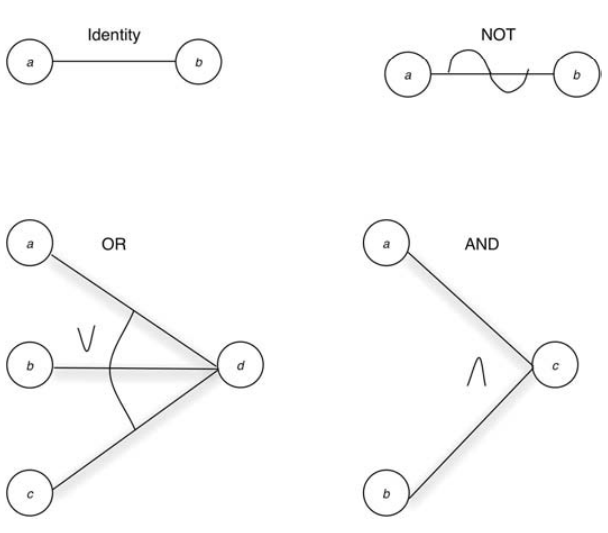
Basic cause-effect graph symbols
Since cause-effect graphing requires the translation of a specification into a Boolean logic network, it gives you a different perspective on, and additional insight into, the specification.
- In fact, the cause-effect graph often uncovers ambiguities and incompleteness in specifications
Example
A system allow an user to login only if the password is valid and the user has the permission
Causes: password validity, permission Effects: login, no login
A graph similar to the last case scenario in the image can be created. A decision table could be derived:
| Test case | C1 (valid password) | C2 (valid permission) | E1 (login) | E2 (no login) |
|---|---|---|---|---|
| TC1 | true | true | true | false |
| TC2 | true | false | false | true |
| TC3 | false | true | false | true |
| TC4 | false | false | false | true |